Ah, debt. The four-letter word that stirs up anxiety and eye twitches in dental practice owners everywhere. Or maybe it’s the four-letter word you’ve become so accustomed to you’re like an adult dropping f-bombs in a kindergarten class without thinking twice. Regardless of where you are in your dental career, you need should be looking at your practice debt.
How much debt is too much?
Let’s be clear: debt itself isn’t bad. In fact, debt can be an incredibly powerful tool to grow your practice. But like anesthesia, it needs to be dosed correctly. Too much, and you risk choking your cash flow. Too little, and you might miss out on opportunities to grow or improve your patient experience.
This post will walk through two simple, powerful tools to evaluate debt in your practice:
- Debt-to-Income Ratio (your monthly cash flow health)
- Debt-to-Revenue Ratio (your overall leverage picture)
We’ll also look at some real-world examples, break down good vs. bad debt, and talk about what healthy ranges look like at different stages of practice ownership.
Metric One: Debt-to-Income Ratio (Monthly Cash Flow Check)
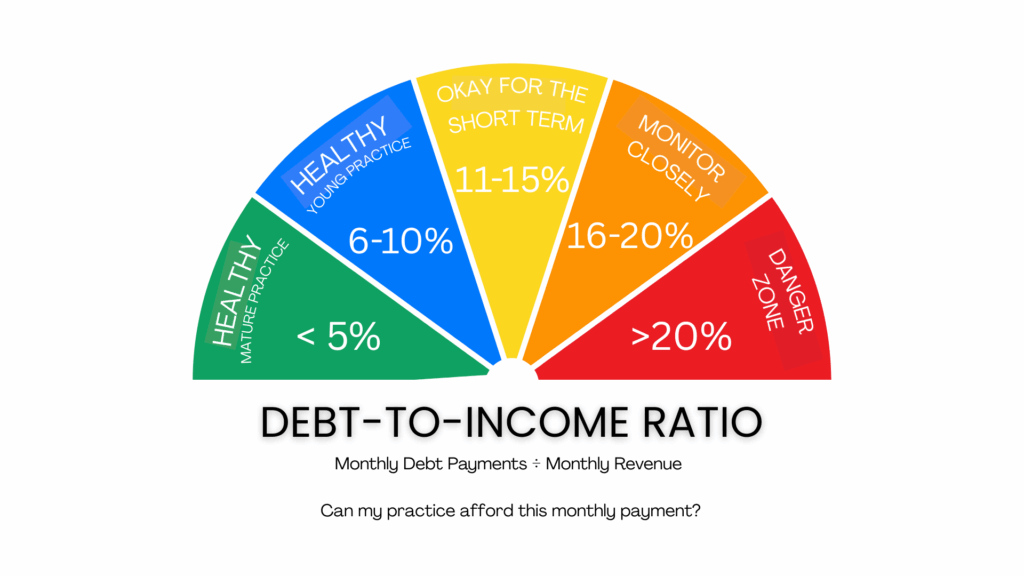
Think of this as your monthly gut check. It answers the question: Can my practice afford this monthly payment?
The Formula:
Monthly Debt Payments ÷ Monthly Revenue = Debt-to-Income Ratio (DTI)
If your practice brings in $100,000/month and you’re paying $10,000/month in loan payments, your DTI is 10%.
But here’s why this number matters: every dollar you spend on debt is a dollar that doesn’t go home with you. It’s a dollar that doesn’t pay your mortgage, feed your kids, or fund your next family trip to Maui.
Yes, some debt is necessary (you need chairs, not tree stumps), but knowing your DTI helps you evaluate how much room you have to take on more.
DTI Risk Meter:
- < 5%: Green light. Mature, healthy practice. You’re in a great spot.
- 6–10%: Still healthy, especially for a younger practice. Expected after a purchase or start-up.
- 11–15%: Yellow zone. OK short-term, but you should aim to reduce it.
- 16–20%: Orange zone. Monitor closely. Adding more debt is risky.
- > 20%: Red alert. High strain. Cash flow is likely being squeezed.
Real-World Example #1: Adding an Operatory
Cost: $100,000 — Financed over 5 years = ~$2,000/month in payments
Estimated new revenue: $15,000/month in hygiene production
DTI impact: ~1.3% increase
Verdict: Green light. This is good debt. Revenue-producing, and improves patient capacity.
Real-World Example #2: Buying a Cone Beam
Cost: $120,000 — Financed = ~$2,200/month
Estimated new revenue: Negligible
DTI impact: Higher, with no offsetting income
Verdict: Yellow light. It may be clinically valuable, but financially it’s a strain unless you’re already in a strong cash position.
Quick Note: What Do Banks Look At?
Lenders often evaluate your global DTI, which includes:
- Practice loans
- Student loans
- Mortgage and car payments
Just because your practice DTI looks fine doesn’t mean the bank won’t pause if your personal obligations are sky-high. So be sure to assess your entire debt picture.
Metric Two: Debt-to-Revenue Ratio (Total Leverage Check)
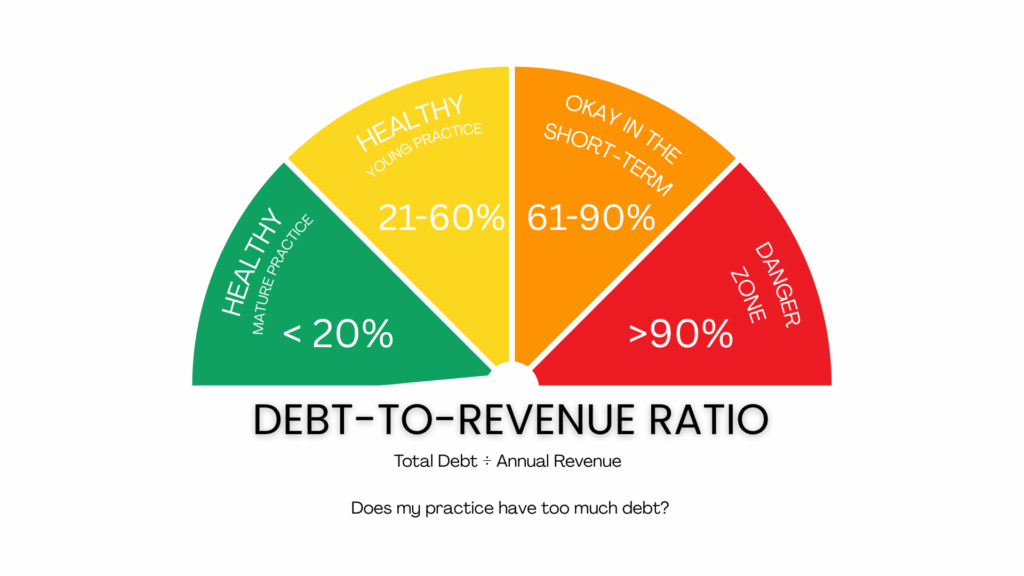
This is your big picture snapshot. It answers: Is my practice overleveraged?
The Formula:
Total Debt ÷ Annual Revenue = Debt-to-Revenue Ratio
This isn’t about monthly payments. This is about how your total outstanding debt stacks up against what your practice earns in a year.
Example:
You buy a practice collecting $1 million per year for $800,000.
Your Debt-to-Revenue Ratio = 0.8 or 80%
Totally normal for year one! But here’s the kicker: that number should come down over time. If you’re five years in and still hovering around 80%, something’s off.
Debt-to-Revenue Ranges:
- < 20%: Healthy, mature practice. You’ve paid down your debt or grown revenue.
- 21–60%: Still healthy. Likely a younger practice or recent acquisition.
- 61–90%: High, but manageable short-term. Needs a clear payoff strategy.
- > 90%: Danger zone. Low equity, high risk. May struggle to sell or walk away cleanly.
Real-World Cautionary Tale:
You buy a $1M practice for $800k (80% debt-to-revenue). Year two, you decide the vibe is off—new flooring, new chairs, cone beam, computers. Another $300k in loans.
Your total debt is now $1.1M on a $1M practice = 110% debt-to-revenue.
You’ve officially entered negative equity territory. Your cash flow gets tight. You can’t sell the practice without bringing money to closing. Moral of the story: Don’t pile on more debt if you haven’t created margin first.
A Quick Word on Start-Ups and Rehab Practices
Start-ups and fixer-uppers will have ugly ratios early on. That’s okay. What matters is the trajectory.
You want to see:
- DTI trending downward after year 1 or 2
- Debt-to-Revenue dropping as production grows
- Strategic use of new debt that leads to actual income
So, How Much Debt Should You Have?
There’s no magic number. But there are clear danger zones. These two ratios give you a way to:
- Evaluate new purchases
- Know when to say yes (and when to wait)
- Stay cash-flow positive while still growing
At the end of the day, debt isn’t evil. It’s a tool. But tools require skill.
Measure before you borrow. Know your ratios. And build a practice that supports your life—not the other way around.